Boost sale conversions with data-driven web design
Increase your website traffic, engagement, and sales consequently through data-driven web design
What is data-driven web design?
An approach to web design based on user data is defined as data-driven design. The key purpose behind data-driven web design is to understand, as well as, prioritize the needs of the users with the help of observable information. Not only does it help make users have a pleasing experience, but it also increases online conversions. Data-driven web design leads to user interaction that is effective and frequent.
Role of analytics – Why should you pay attention?
![]()
The truth is that we live in times where everything is tracked, especially online. What we are clicking, watching and browsing. Some say its breaching our privacy and others say that you agreed on it. Well tracking is here to stay and if you are not taking advantage of the data, your competitor will and that gives them leverage to be better.
To break down why data driven web design needs your attention, we’ll list what you are missing out on:
- Increasing sales
- More return on your investment
- Offering great online experience to your users
- Gathering more leads and contact information
And aren’t we all trying to get more of that? By tracing and following the data, we know what and where to improve on our designs. There is no need for blind guesses.
Which website metrics you need follow?
There are way too many metrics that seem to come out of a sci-fi movie, but we will try and show you the most frequently used ones. One thing you should definitely do thought, is to start tracking from the launch of your website. It’s important to track traffic, especially from the start when you have small amount of users, since it takes time to build up large enough of a sample to get to any logical conclusions.
So, now the question arises. Which are the most used website metrics?
Bounce rate:
Bounce rate is defined by the ratio between the total number of visitors to those who bounced from your website as they did not get what they wanted. More specifically, they left your website after vising only one page.
CTR (Clickthrough Rate):
CTR is defined as the ratio of the people viewing your ad to those clicking on it.
Cart Abandonment rate:
This rate reflects the number of customers that got attracted to your website and offering, but failed to pull the trigger and purchase while being in the cart.
Conversion rate:
This enables you to identify the visitors that happen to do an action on your website or ads. Purchases, clicks on call to action buttons, add to cart and any other click action has a conversion rate.
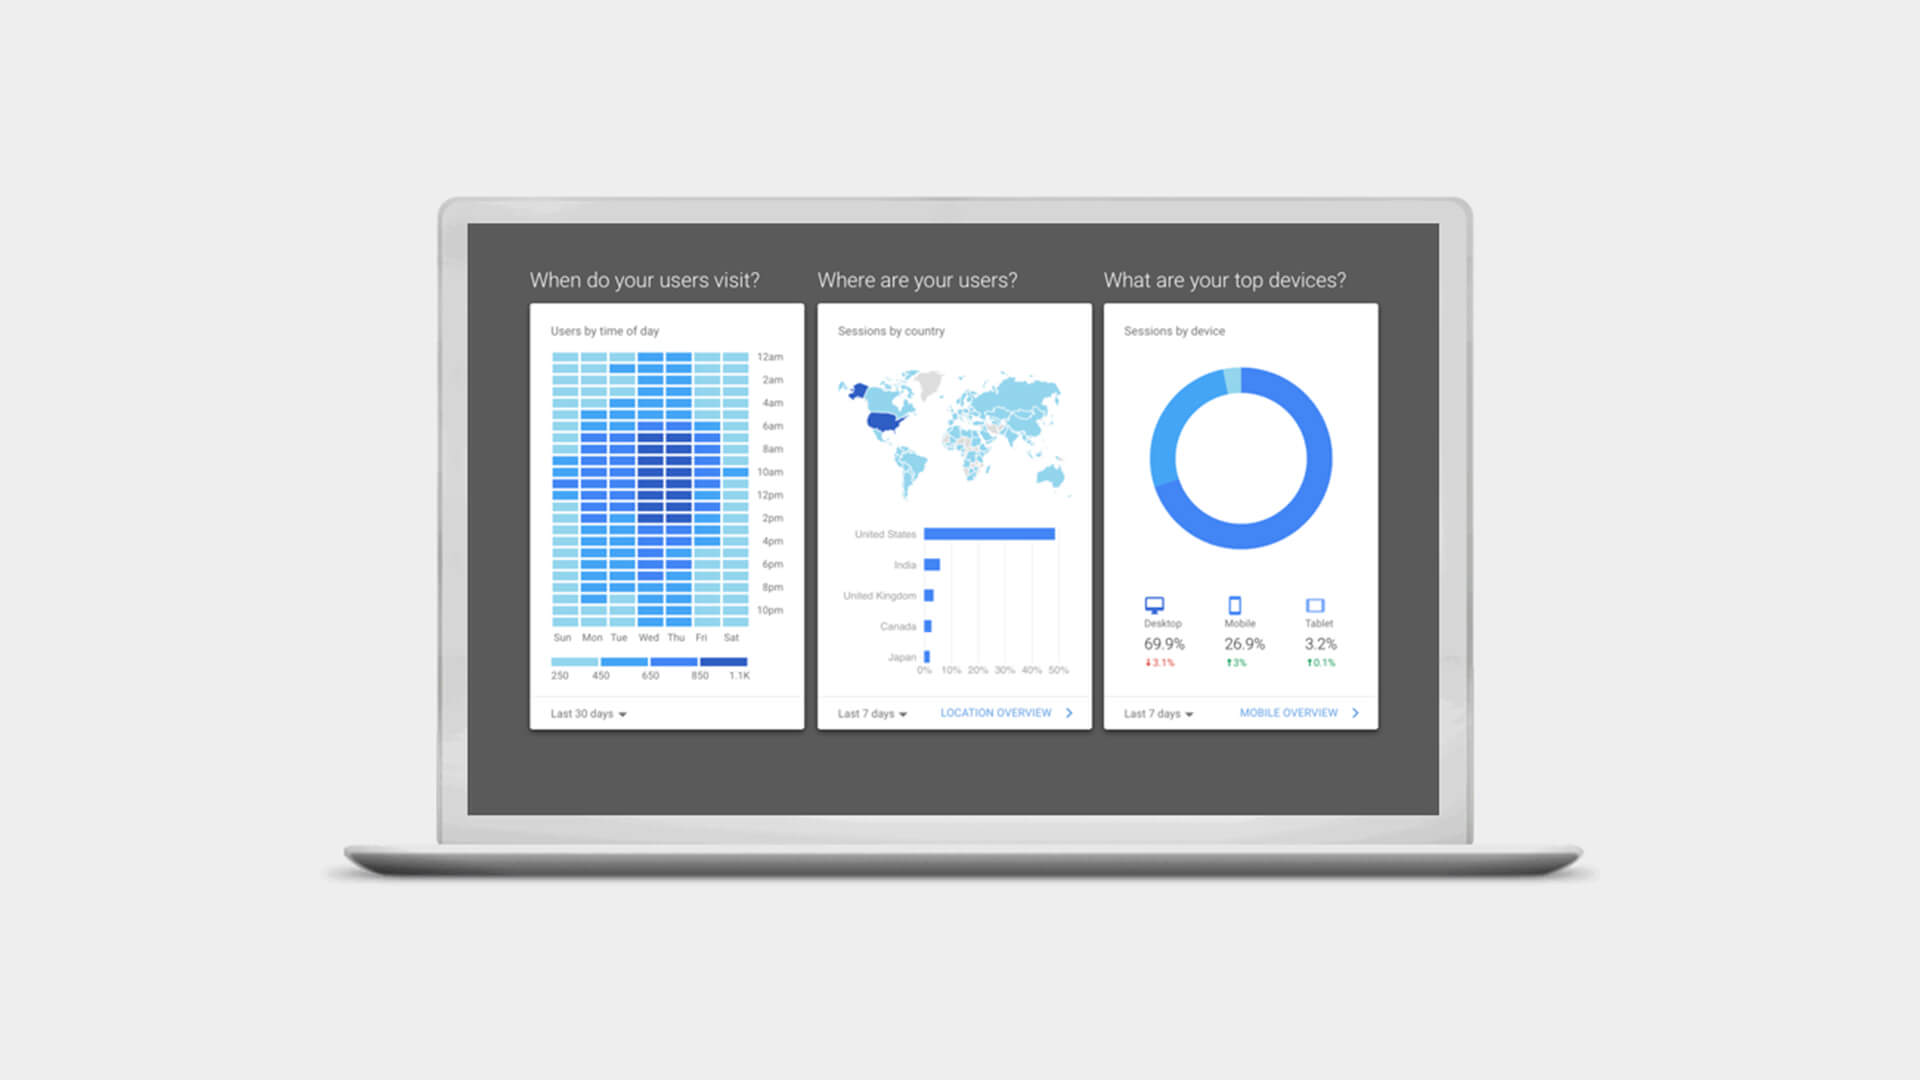 Digital Insights by Google Analytics
If you want to identify the underlying issues and drawbacks in your web design, then Bounce Rate and Cart Abandonment Rate are the best metrics for you because you will know how many visitors do not find in your website what they are looking for and which area you lack that is failing to make them convert. Based on these identifications, you can try different designs the smart way. You can A/B test different button or text locations, which will enable you to increase your engagement and sales consequently.
Measure and Test - What Google Analytics, Facebook Pixel, and Yandex Metrica do?
One common thing the three of the platforms do is track data. Each one of them has its specific case use, but as a heads up we can say that its good to use them all. Let’s break them down in bullet points to get the basic ideas of what they do:
- Google Analytics – Tracks website data, all conversions such as cart or checkout abandonment.
- Facebook Pixel – Tracks and collects information of your traffic. If you are advertising on Facebook/Instagram, it will make your ads more accurate which increases you conversion rate.
- Yandex Metrica – Just like Google Analytics, it tracks website data but with an extra twist. It records what your traffic clicks in video and heatmaps that show heat zones of what is clicked or not.
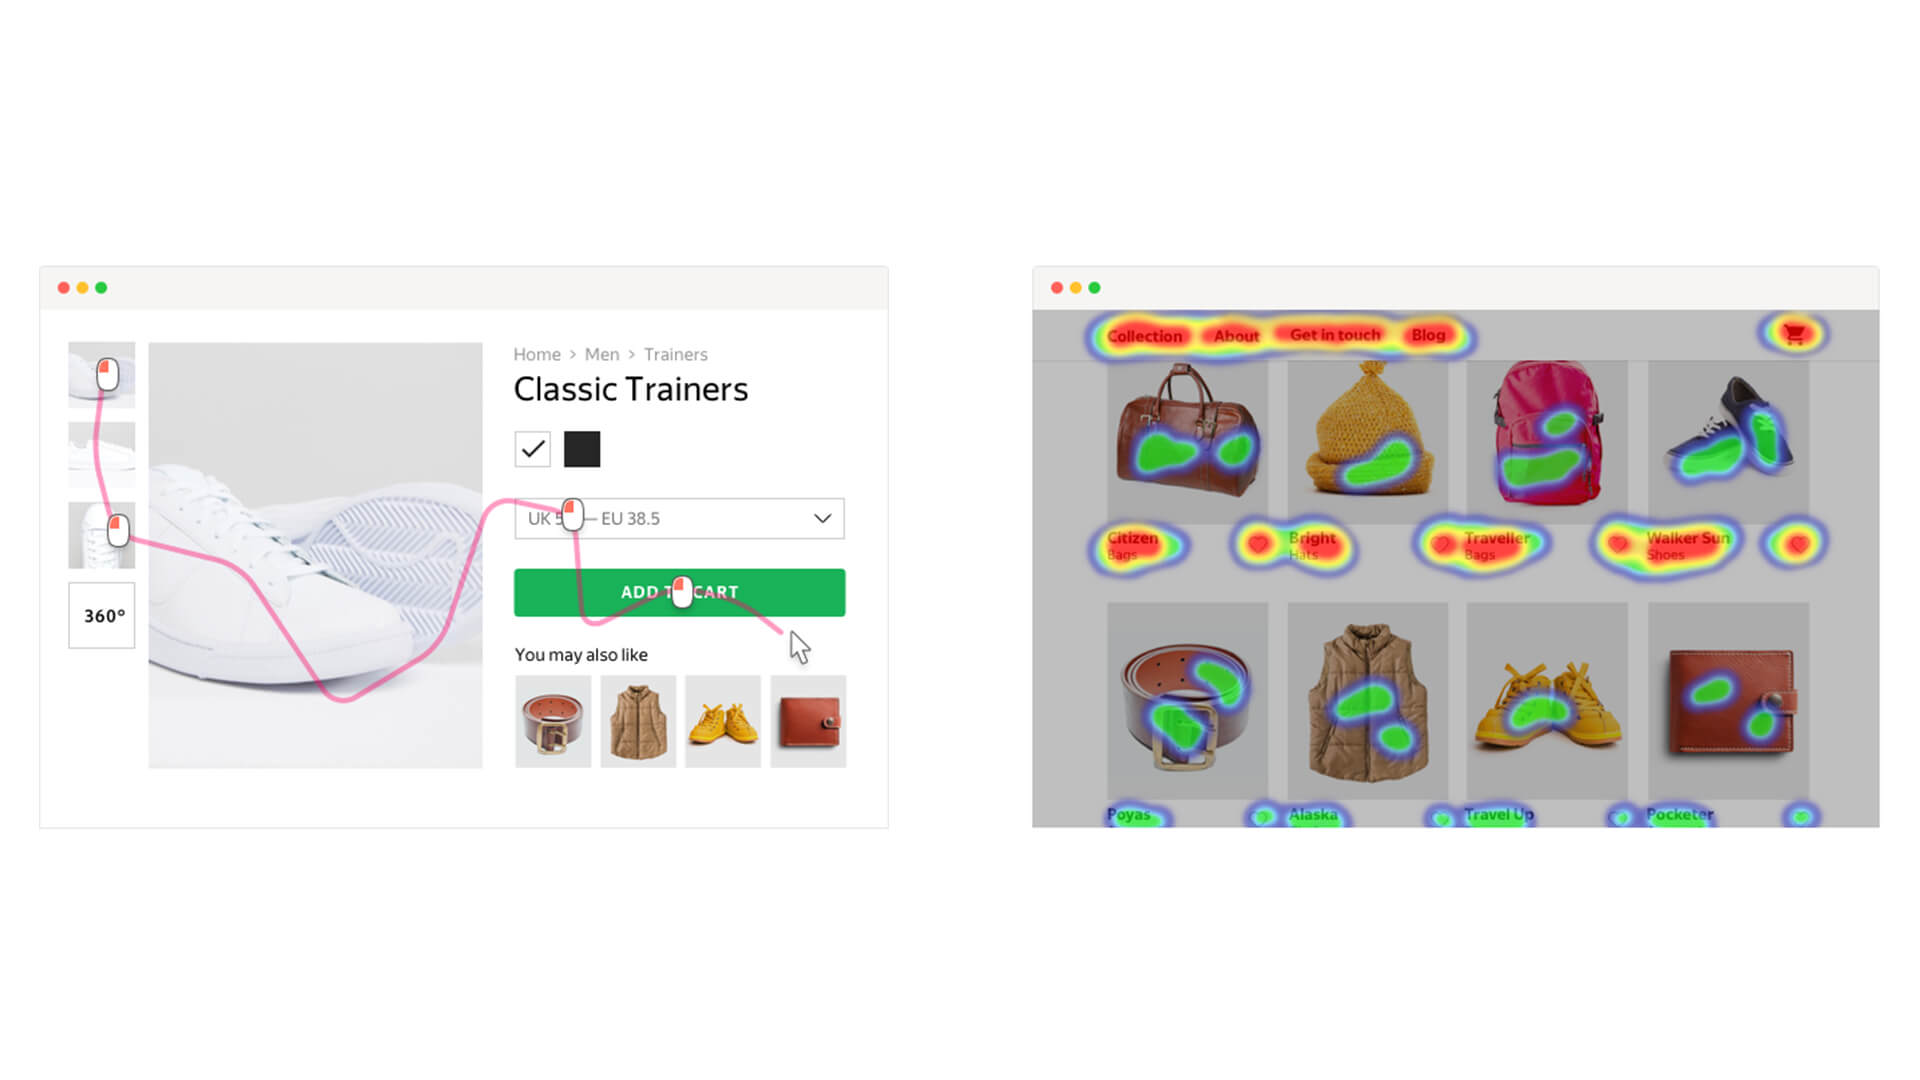 Browsing replays & Click Heat Maps by Yandex
So whatever a user is doing on your page, you can observe and if there are any obstacles you can correct them. Basically, it’s like standing right next to them, following each click on your webpage. Of course, you have to do your due diligence and comply with any regulations like GDPR, but its not something you can’t go around. The tools are right in front of us, and they are ready to be put in action. Track and A/B test your designs accordingly.
So can you increase your sales with boring data?
The answer is yes. You can.
By tracking what your audience is doing you can see the reasons why they didn’t click what you intended them to and improve your design. Imagine if your mobile cartabandonment was through the roof. Go through the recorded data and you might see the missing piece, it might be your site is not optimised for mobile use or they can’t see the next button. It can be a basic issue but hurts the wallet.
By choosing the right tools and appropriate web design, you are most likely to deliver to your target customers what they want. Right analytics and metrics will tell you where you lack and you will be able to overcome your shortcomings while increasing the engagement of your website and consequently, you will boost your sales.